Relevant information about this
surface page
 Weather stations all over the world report weather conditions every hour using a
data format
referred to as METAR (this is a French acronym with a loose English translation to "routine
aviation weather observation"). These data are collected centrally by the U.S. National
Weather Service (and other country's equivalents) and distributed. The
Surface data page provides a FORM interface so that you
can retrieve these data in their raw format or you may choose to translate them to a more
human-friendly format. See the accompanying stations.txt
file for a list of worldwide airports that report METARs. For example, knowing that
Denver, Colorado's airport identifier is "KDEN", you can simply retrieve the
latest 24 hours worth of METARs by entering that string (without the double-quotes)
into the text FORM field. You may enter as many stations as you like and simply separate
them using a space and/or comma but you must use the full 4-letter ICAO abbreviation.
Alternatively, you may mix with state abbreviations of the form "@CO" (upper
and/or lower case are both valid). So, for example, you can enter the following:
KDEN KAKO KSNY KBFF @WY
And, if you own a 3Com Palm Pilot, you can also get this same
data wireless. See this link for
more details.
Weather stations all over the world report weather conditions every hour using a
data format
referred to as METAR (this is a French acronym with a loose English translation to "routine
aviation weather observation"). These data are collected centrally by the U.S. National
Weather Service (and other country's equivalents) and distributed. The
Surface data page provides a FORM interface so that you
can retrieve these data in their raw format or you may choose to translate them to a more
human-friendly format. See the accompanying stations.txt
file for a list of worldwide airports that report METARs. For example, knowing that
Denver, Colorado's airport identifier is "KDEN", you can simply retrieve the
latest 24 hours worth of METARs by entering that string (without the double-quotes)
into the text FORM field. You may enter as many stations as you like and simply separate
them using a space and/or comma but you must use the full 4-letter ICAO abbreviation.
Alternatively, you may mix with state abbreviations of the form "@CO" (upper
and/or lower case are both valid). So, for example, you can enter the following:
KDEN KAKO KSNY KBFF @WY
And, if you own a 3Com Palm Pilot, you can also get this same
data wireless. See this link for
more details.
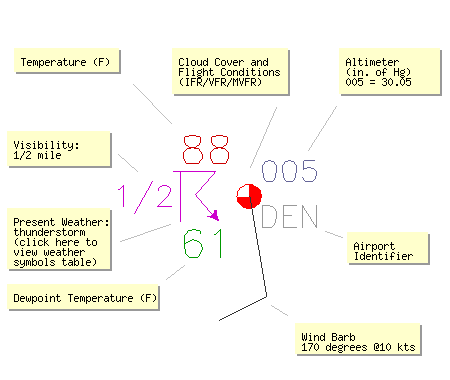
Meteorologists in the U.S. are accustomed to viewing the surface
station data in a format like that shown here. Unfortunately Fahrenheit is still commonly
used in the U.S. for temperature and dewpoint information. The field found to the upper
right of each station location is mean sea-level pressure (MSLP) as of April 1, 2002.
Prior to this date, the value shown was altimeter setting. With either MSLP or altimeter,
the leading digit(s) is dropped (9 or 10 in the case of MSLP and 2 or 3 in the case
of altimeter). In other words, a MSLP value of 983.6 mb
is plotted as "836" while 1021.3 is plotted as "213". The graphic here is
self-descriptive but for aviation purposes the cloud coverage amount is
colorized red for Instrument Flight Rule conditions (IFR), magenta for low-IFR (LIFR),
green for Visual Flight Rules (VFR) and blue for Marginal VFR. (see table below)
By clicking on the wind barb on this graphic, you can
view another page containing a wind
barb description. Furthermore, the weather symbols used by meteorologists are
quite cryptic (and in bad need of modernizing by the World Meteorlogical Organization) and
a full table of these graphics is
obtained by clicking the Present Weather label on the graphic.
- Flight category definitions:
| Category |
Ceiling |
|
Visibility |
Low Instrument Flight Rules
LIFR* (magenta circle) |
below 500 feet AGL |
and/or |
less than 1 mile |
Instrument Flight Rules
IFR (red circle) |
500 to below 1,000 feet AGL |
and/or |
1 mile to less than 3 miles |
Marginal Visual Flight Rules
MVFR (blue circle) |
1,000 to 3,000 feet AGL |
and/or |
3 to 5 miles |
Visual Flight Rules
VFR+ (green circle) |
greater than 3,000 feet AGL |
and |
greater than 5 miles |
*By definition, IFR is ceiling less than
1,000 feet AGL and/or
visibility less than 3 miles while LIFR is a
sub-category of IFR.
+By definition, VFR is ceiling greater than
or equal to 1,000 feet AGL and visibility greater
than or equal to 3 miles while MVFR is a
sub-category of VFR.
|
- Cloud coverage symbols:
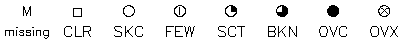
Automated stations report "CLR" when clouds may exist
above 12,000 feet so a square is used to represent this
uncertainty whereas an unfilled circle is used for "SKC"
which a human reports the sky is completely clear overhead.
The abbreviation "OVX" is unofficial but we use it
here to indicate the sky is obscured which is the case when a
METAR reports vertical visibility and no cloud information.
|
Present Weather symbols
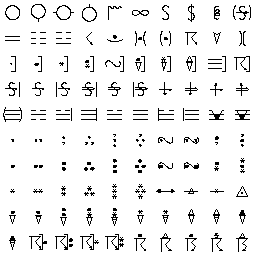 Plots of station data may include one of the following symbols to represent the
present weather. METARs may include more than one type of weather condition
but only one icon ever gets plotted. Two additional documents show the original
descriptions abridged from the World Meteorological Organization (WMO) and
which symbol you will find for which METAR present weather text string.
These are not necessarily official but they represent my best matching of
weather conditions to the original WMO table of icons.
Plots of station data may include one of the following symbols to represent the
present weather. METARs may include more than one type of weather condition
but only one icon ever gets plotted. Two additional documents show the original
descriptions abridged from the World Meteorological Organization (WMO) and
which symbol you will find for which METAR present weather text string.
These are not necessarily official but they represent my best matching of
weather conditions to the original WMO table of icons.
Original WMO table and abridged descriptions of symbols:
wxSymbols_anno1.pdf (287 KB).
Text string for present weather found in METARs mapped to icons and
plotting priority order:
wxSymbols_anno2.pdf (313 KB).
|
Wind Barb
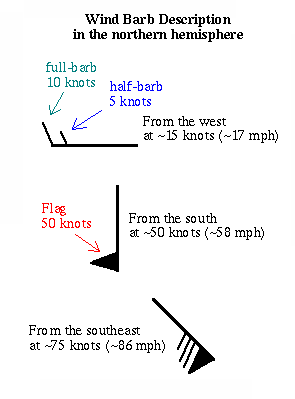 Wind barbs are simply a conventient way to represent both wind speed and
direction in a compact graphical form. Vectors also work to some degree
but it is more difficult to discern the magnitude when viewing vectors.
For this reason, meteorologists prefer the use of wind barbs. The graphic
here clearly shows how to read a wind barb. Meteorologists are also
accustomed to nautical miles per hour (knots) for the magnitude of the
wind. Convert to statute miles per hour (mph) by adding 15% to
the value in knots. Example: 60 knots = 60 + 9 mph. [Just remember to
figure it the same way you would figure a 15% tip at a restaurant
by taking 10% and then halve that
value ;-) ]
Wind barbs are simply a conventient way to represent both wind speed and
direction in a compact graphical form. Vectors also work to some degree
but it is more difficult to discern the magnitude when viewing vectors.
For this reason, meteorologists prefer the use of wind barbs. The graphic
here clearly shows how to read a wind barb. Meteorologists are also
accustomed to nautical miles per hour (knots) for the magnitude of the
wind. Convert to statute miles per hour (mph) by adding 15% to
the value in knots. Example: 60 knots = 60 + 9 mph. [Just remember to
figure it the same way you would figure a 15% tip at a restaurant
by taking 10% and then halve that
value ;-) ]
|
|
|